GigiZara Case Study: Shopify Sales +235% in 131 Days | FenixSkip to content
GigiZara × Fenix · Client case study · 2026
GigiZara's Shopify Sales Rose 235% in 131 Days. Here's What We Changed.
GigiZara did not need somebody to tell the founder to make more content. The Puerto Rico-rooted swimwear label already had original designs, real campaign imagery, UGC, runway exposure and an unusually deep visual library. But the business was still facing difficult acquisition economics. (GigiZara)
Fenix began working with GigiZara on June 10, 2026. We restructured Meta acquisition, connected purchase-intent audiences with Klaviyo follow-up, worked on Shopify's customer journey and evaluated pricing for a business whose demand changes with the season.
Between June 10 and October 18, Shopify recorded $73,252.41 in total sales, 235% above the immediately preceding 131-day period. This is a documented sequential comparison, not year-over-year growth or proof that every additional sale came from a single change.
Five Stops Between An Ad And A Completed Checkout.
Scroll to walk one GigiZara shopper's route. Stop one is Meta's own count. Stops two to five are Shopify's, for June 10 to October 18, 2026. The funnel counts sessions at each step, so it shows how traffic moves, not the path of any one person.
The walking figure is an illustration, not a GigiZara photograph and not the founder. Skip the walk
1Ad
2Visit
3Cart
4Checkout
5Purchase
Stop 1 of 5 · The ad
2,981,917
Meta impressions, with 691,100 reach
Meta puts GigiZara's creative in front of people who may never have heard of the brand. Impressions count views, not people. Reach is the number of Meta accounts that saw an ad.
Source: Meta Ads Manager, Jun 10 to Oct 18, 2026, 17 campaign rows. Platform-reported.
Stop 2 of 5 · The visit
72,550
Shopify sessions, +111% against the prior 131 days
The ad does its job when someone arrives and finds a product worth a closer look. Shopify flags a session definition change late in this period, so treat the growth rate as Shopify-reported.
Source: Shopify Analytics, Jun 10 to Oct 18, 2026. Compared with January 30 to June 9, 2026.
Stop 3 of 5 · Added to cart
2,861
Added to cart, 3.94% of sessions, +68%
The shopper has chosen a piece. This is where Klaviyo flows and Meta audiences start to treat someone who added to cart differently from someone who only browsed.
Source: Shopify conversion rate breakdown. Shopify counts sessions at each step, not individual people.
Stop 4 of 5 · Checkout
1,134
Reached checkout, 1.56% of sessions, +70%
39.6% of the sessions that added to cart also reached checkout (our calculation from the two counts). Someone here is closer to buying than someone who only watched a video.
Source: Shopify conversion rate breakdown. The percentage is derived.
Stop 5 of 5 · Purchase
619
Completed checkouts, 0.85% of sessions, +145%
54.6% of the sessions that reached checkout also completed it (derived). Shopify counts 754 orders and 767 fulfilled orders separately, and Meta reports 650 attributed purchases. These are different counts and are not added together.
Source: Shopify conversion rate breakdown, and Meta Ads Manager for the Meta figure.
The founder had the assets
A Designer's Vision Wasn't The Missing Part.
Raiza, GigiZara's founder and designer, is from Puerto Rico and develops the swimwear herself. The label is shaped by a distinctly Caribbean sensibility, from fit and silhouettes to print and color. GigiZara also has something many ecommerce businesses spend years trying to accumulate: a substantial archive of professional campaign photographs, styled editorial shoots, product demonstrations and creator content.
The brand has appeared in Miami Swim Week 2026 coverage, including runway material published by EXA Shows. That history predates Fenix's engagement and belongs to the work Raiza had already put into the brand.
The first strategic problem was not the absence of content. It was how to make existing creative inventory work harder in acquisition, product discovery and conversion, without expecting a strong photo or video alone to overcome weak unit economics.
Brand-led portraitA GigiZara-branded prop beside the product.Duo stylingTwo looks and two colorways in one frame.Range beyond the beachA setting that is not poolside.
Campaign photographs supplied by GigiZara and shown uncropped. The models are not identified. These captions describe creative formats, not winning ads.
The economic problem
A Strong Creative Library Doesn't Fix An Expensive Customer.
Before the Fenix engagement, the business had been experimenting with different agencies, approaches and paid advertising. According to the account owner's initial assessment, purchase acquisition was expensive relative to the value of the order and the margin left after it. This is where we focused: not on making the ad account look busier, but on connecting traffic cost, offer, customer value and the final Shopify transaction.
For swimwear, the economics also change with the calendar. A promotion that can acquire customers during the strongest summer weeks may not produce the same outcome outside peak season. Discounting can move inventory but can also reduce the cash available to acquire the order.
The problem was not creative scarcity. It was making a high-volume creative library commercially useful under different seasonal economics.
The account owner's earlier cost and ROAS figures are not shown here. No earlier dashboard was supplied to support them, so they are left out of the numbers.
An editorial interlude from GigiZara's campaign library.
Seasonal pricing and offer economics
Summer Volume Is Not A Twelve-Month Pricing Strategy.
Atmosphere from the campaign library, shown uncropped.
Fenix worked with GigiZara on pricing and promotional choices that take seasonality seriously. During the peak swimwear period, shoppers may be responding to travel, beach, pool and vacation demand. Outside that window, the offer has to work harder against reduced category urgency and continuing acquisition costs.
Rather than assuming a deeper discount is always the answer, pricing decisions have to be weighed against average order value, product cost, acquisition cost, shipping and the contribution the business needs to retain. Top-and-bottom set building, product presentation and promotional framing all change what the customer sees as valuable.
The actual Shopify data illustrates why this matters. For June 10 to October 18, 2026, the store reported $92,737.46 in gross sales and $23,294.08 in discounts, equivalent to about 25.12% of gross sales. After sales reversals, Shopify net sales were $69,049.25. This does not prove a particular price test succeeded, but it makes clear why discount strategy belongs in the acquisition conversation. For the cash side of this, see why Shopify sales can rise while cash runs out and how Shopify discounts can stack against your profit.
25.12%of reported gross sales went to discounts. A share of gross sales, not a share of profit.
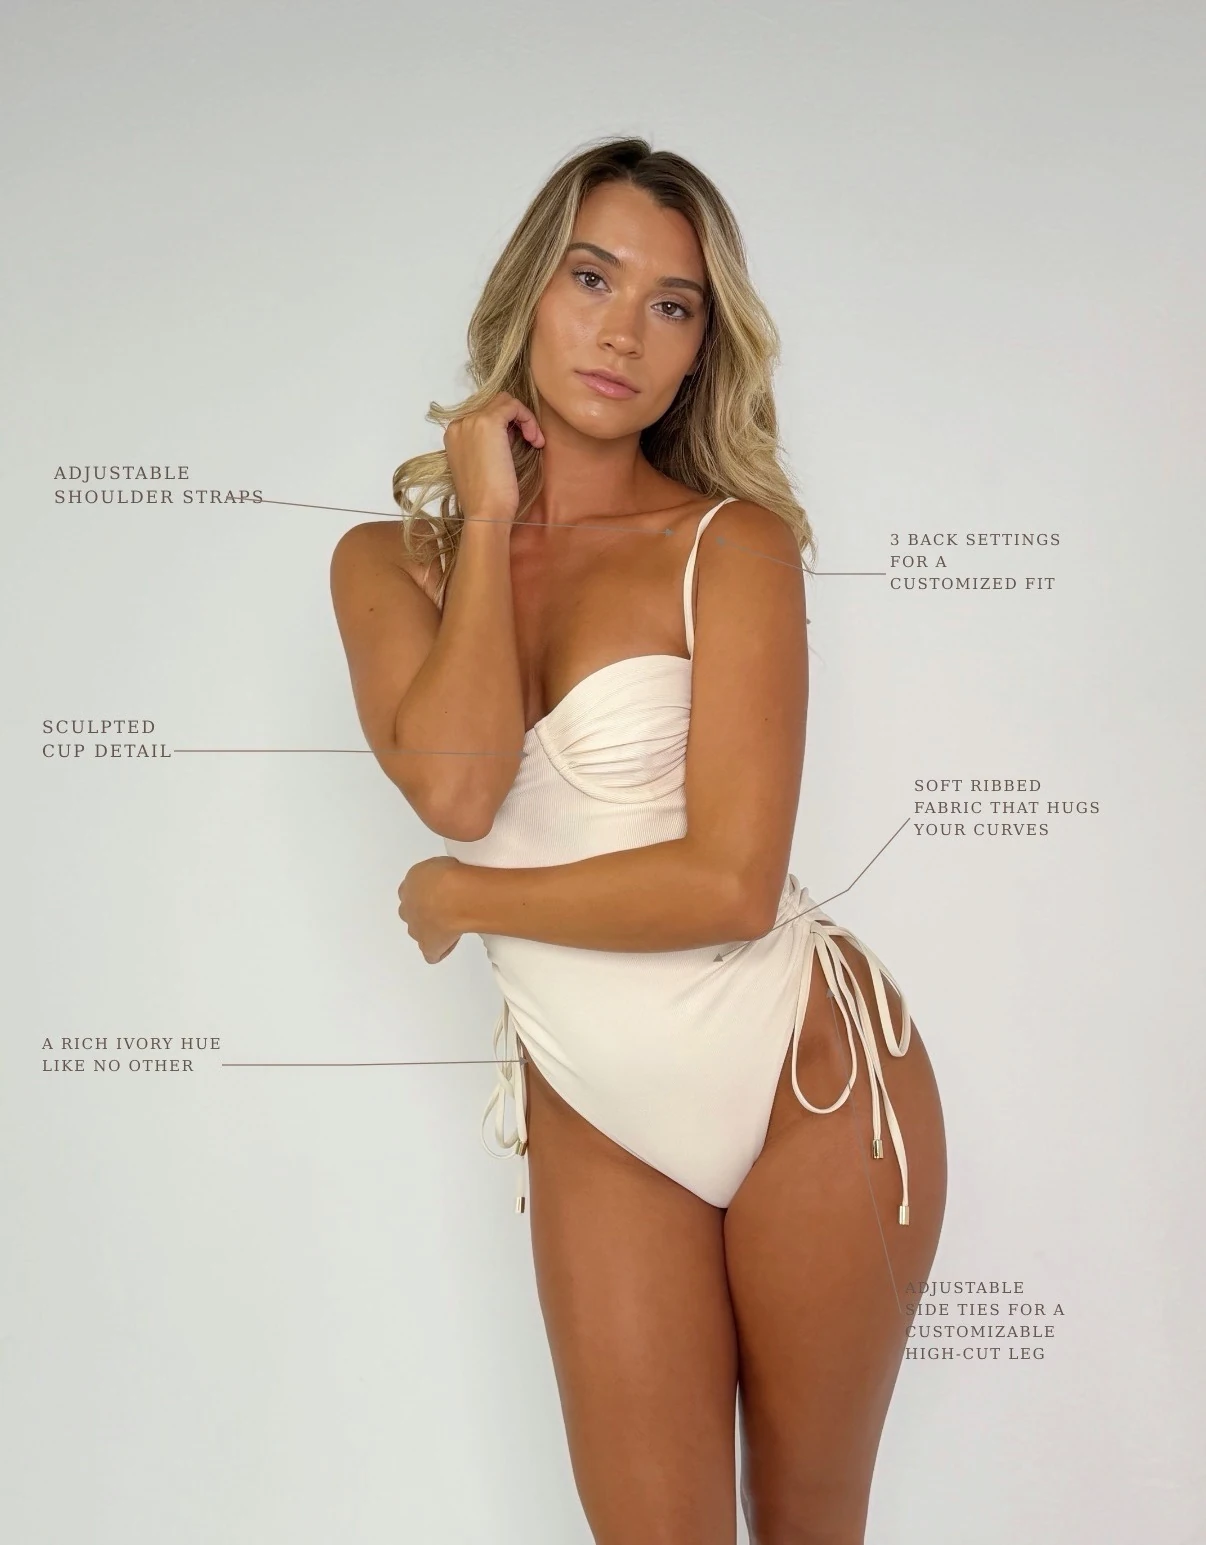
Product detail can carry part of the value argument.
A product image that labels the strap, fabric and fit adjustments gives a shopper something concrete to weigh against price. It is an example of existing creative, not a validated before-and-after design from Fenix.
Product-feature storytelling from the GigiZara library.
From gross sales to total sales
What Shopify Kept After Discounts: A Gross-To-Net Bridge
LineAmountRunning total
Gross sales$92,737.46$92,737.46
Discounts−$23,294.08$69,443.38
Sales reversals−$394.13$69,049.25
Net sales$69,049.25$69,049.25
Shipping charges+$2,726.00$71,775.25
Taxes+$1,477.16$73,252.41
Total sales$73,252.41$73,252.41
A reporting bridge between Shopify's own lines for June 10 to October 18, 2026. It does not calculate profit. Net sales and total sales are different measures. Every row reconciles to the cent, and the amounts left over after ad spend are not called profit.
Meta, Klaviyo and site experience
We Stopped Treating Every Visitor Like A First-Time Shopper.
Fenix restructured Meta acquisition around creative relevance and the stage of purchase intent. The approach combined product-led prospecting with more specific follow-up for people who had already demonstrated interest through viewing products, adding to cart or reaching checkout.
We also built a Klaviyo flow foundation that had not previously been established. The goal was to respond to intent through relevant email communication and Meta audience segmentation rather than waiting for every visitor to re-enter through another cold ad. The wider problem is covered in why Shopify shoppers add to cart but do not buy.
At the same time, Fenix worked on the Shopify customer journey and user interface so that the product experience, merchandising and purchasing path better supported the person arriving from an ad.
Creative libraryPhotos, video and UGC
Meta ad messagesMatched to intent
Relevant product or collection viewFrom the ad to the product
Cart or checkout signalAdded to cart or reached checkout
Path A
PurchaseA Shopify transaction
Path B
Klaviyo follow-up and Meta remarketing audienceBased on how far the shopper got
Potential return visitThe same decision, continued
PurchaseA Shopify transaction
Not every purchase follows Path B, and attributed purchases are not necessarily unique or incremental.
Across the 131-day reporting period, Meta recorded 650 website purchases at $75.32 cost per reported purchase on $48,961.15 in spend. Two cart-intent campaigns shown in the source data together recorded 300 attributed purchases on $18,118.48 spend, or $60.39 weighted reported CPA. That is promising directional evidence for differentiated audience handling, not proof that Klaviyo generated 300 new orders. The campaign rows are in the evidence section.
650
Meta-reported website purchases
$75.32
Cost per reported purchase
$48,961.15
Meta spend, Jun 10 to Oct 18, 2026
$60.39
Weighted CPA, two cart-intent campaigns (300 purchases, $18,118.48)
Original GigiZara photography. Creative variation, not a performance claim.Original GigiZara photography. Creative variation, not a performance claim.
Original verified results
What Changed In Shopify. What Meta Reported. What We Cannot Claim.
The most useful case studies do not mix every dashboard into a single revenue number. Shopify records what happened in the store. Meta reports conversions attributed to advertising under Meta's rules. Both help explain decisions, but they are not the same measurement system.
From June 10 to October 18, 2026, Shopify reported $73,252.41 in total sales, up 235% against the prior 131-day period. Sessions increased 111%, average order value increased 24%, and Shopify's reported conversion rate increased 16%. Reported sales growth reflects the observed period, not a seasonality-adjusted test proving the exact contribution of Fenix's interventions.
Meta separately reported $48,961.15 in spending and 650 platform-attributed website purchases with $75.32 CPA. The platform uses attribution rules that do not necessarily match Shopify's checkout and order counts, so the purchase number is never a count of additional unique Shopify buyers. For why the platforms disagree, see why Meta, Google and Shopify report different revenue.
The resulting 1.50x Shopify-total-sales-to-recorded-Meta-spend ratio is a cross-system diagnostic figure, not Meta ROAS and not a profit margin. Other business costs are not disclosed in this case. For why a ratio like this is not a profit signal, see why a high ROAS does not automatically mean profit.
A. Verified proof strip
Four Figures, With Their Windows
$73,252.41Shopify total salesJun 10 to Oct 18, 2026
$69,049.25Shopify net salesAfter discounts and reversals
$92.09Average order valueShopify, Jun 10 to Oct 18, 2026
$48,961.15Meta amount spentMeta Ads Manager, Jun 10 to Oct 18, 2026
The 1.50x store-sales-to-Meta-spend ratio divides Shopify total sales by recorded Meta spend. It is not Meta ROAS. Shopify net sales less Meta spend is $20,088.10 before product cost, payment processing, fulfillment, agency fees, operating expenses and any other acquisition cost. That is not profit. Shopify AOV of $92.09 against Meta CPA of $75.32 leaves a simple $16.77 difference, but the two figures count different things, so it is not a per-order margin.
B. Change against Shopify's immediately preceding 131 days
Sales Rose Faster Than Traffic. Discounts Were Part Of The Picture.
Gross sales+297%
Total sales+235%
Net sales+233%
Sessions+111%
Average order value+24%
Shopify-reported conversion rate+16%
Percentages as Shopify reports them for June 10 to October 18, 2026 against January 30 to June 9, 2026. Sequential periods that cross a seasonal change, not year over year. No monthly points are reconstructed from the screenshots. The conversion-rate change carries Shopify's definition-change caveat.
C. Meta spend by campaign row
Two Cart-Intent Campaigns Took 37.01% Of Spend And Reported 46.15% Of Purchases
Campaign row 1 (cart-intent)175 purchases, $56.47 per purchase$9,882.38
Campaign row 2 (cart-intent)125 purchases, $65.89 per purchase$8,236.10
Campaign row 363 purchases, $70.82 per purchase$4,461.83
Campaign row 444 purchases, $83.95 per purchase$3,693.62
Campaign row 539 purchases, $93.90 per purchase$3,662.15
Campaign row 634 purchases, $104.64 per purchase$3,557.70
Campaign row 719 purchases, $175.45 per purchase$3,333.55
Campaign row 843 purchases, $70.00 per purchase$3,010.09
Campaign row 925 purchases, $73.03 per purchase$1,825.77
Campaign row 1016 purchases, $100.25 per purchase$1,603.96
Remaining 7 rows (derived)67 purchases, from the rows not visible$5,694.00
Ten rows are visible in the redacted screenshot. The seventeen-row total is $48,961.15, so the remaining seven rows are our derived remainder ($5,694.00, 67 purchases). The two cart-intent rows, as labelled in the original account view, reported 300 purchases on $18,118.48 at $60.39. The other 15 rows together reported 350 purchases on $30,842.67, about $88.12 each (our calculation). Rows differ in purpose and attribution settings, so this is directional, not like-for-like, and it does not show Klaviyo caused any purchase.
D. The arithmetic
Open The Numbers Behind The Bridge
Show the revenue math as a table
Exact arithmetic, as Shopify reports each line
Gross sales
$92,737.46
Discounts
−$23,294.08
Sales reversals
−$394.13
Net sales
$69,049.25 (gross less discounts less reversals)
Shipping charges
+$2,726.00
Return fees
+$0.00
Taxes
+$1,477.16
Total sales
$73,252.41
Discounts as a share of gross sales
25.12% (23,294.08 / 92,737.46)
Source evidence
The original dashboards, uncropped
Three images as supplied. Meta campaign names are blurred, and the original unblurred image is not published. Captions sit outside each image.
Shopify
Meta
Shopify sales dashboard
Source
Shopify Analytics
Period
June 10 to October 18, 2026, compared with January 30 to June 9, 2026
Shows
Total sales over time, the total sales breakdown from gross sales to total sales, orders, fulfilled orders, returning customer rate, sales by channel, average order value and sales by product.
Limit
Net, gross and total sales are different measures. Change figures are as Shopify displays them. The sales-by-channel panel shows its own change figure (117%) for $73.2K; this case relies on the headline total sales card (235%).
Shopify sessions, conversion and funnel
Source
Shopify Analytics
Period
June 10 to October 18, 2026, compared with January 30 to June 9, 2026
Shows
Sessions and conversion rate over time with a definition-change marker, and the conversion funnel from sessions to completed checkout.
Limit
Shopify flags a definition change inside the period, so the conversion rate is Shopify-reported, not a normalized lift. 619 completed checkouts is a different count from 754 orders.
Meta Ads campaigns, names redacted
Source
Meta Ads Manager
Period
June 10 to October 18, 2026
Shows
Results, cost per result, amount spent, impressions, reach and attribution setting for 17 campaign rows, with campaign names blurred.
Limit
Platform-reported under Meta attribution rules, with attribution settings that vary by row. Not the same as Shopify orders or completed checkouts. The original unblurred image is not published.
How We Measured This Case
Shopify totals are business-level, platform-reported store sales, not profit.
Meta results are attributed under platform reporting rules. Counts need not reconcile one-to-one with Shopify checkouts.
Shopify's comparison is sequential and crosses a seasonal change. Seasonality cannot be separated from Fenix's impact using these screenshots.
Shopify's session and conversion reporting flags a definition change during the observation period. What changed in the rules is covered in the September 2026 session rules.
Klaviyo flow-level revenue is not disclosed. Klaviyo-attributed revenue is not added to Shopify sales.
Cost of goods, margin, fulfillment and full operating expenses are not included, so contribution profit and return on investment are not known.
Previous agency metrics are account-owner-reported and were not audited in this release.
Raiza created the product and continued investing in original fashion content. Fenix's role was to bring acquisition, lifecycle marketing, pricing and Shopify experience into a more coherent commercial system. Her perspective matters because the work required a founder willing to test more than advertising creative.
GigiZara campaign photograph. The model is not the founder and is not identified.
Original operating findings
Five Things A Content-Rich Shopify Brand Can Learn From GigiZara.
More Creative Is Not A Strategy.
A large image and video library creates opportunities for segmentation, but customer acquisition only improves when the right message reaches the right shopper at a tolerable cost.
Cart And Checkout Intent Deserve Distinct Follow-Up.
A shopper who reached checkout is not necessarily in the same state as one who only watched a video. Lifecycle messaging should recognize that difference.
A Dramatic Sequential Sales Increase Still Needs Honest Measurement.
Shopify reported +235% total sales against the immediately preceding 131 days, but the dates cross seasonal periods and do not isolate a causal increment from any single tactic.
Raiza is the founder and designer behind GigiZara Swimwear. The brand is rooted in Puerto Rico, and she designs the swimwear pieces herself. GigiZara has also appeared in Miami Swim Week 2026 runway coverage, which predates Fenix's June 2026 engagement.
How much did GigiZara sell after starting with Fenix?
Shopify recorded $73,252.41 in total sales from June 10 to October 18, 2026. Shopify displayed a 235% increase compared with the immediately preceding 131-day period. This is a sequential observation and is not a controlled, seasonally adjusted measure of Fenix's incremental contribution.
What did Fenix Network Media change for GigiZara?
Fenix restructured Meta acquisition, worked on Shopify CRO and the customer journey, established Klaviyo flows and stage-based follow-up, connected Shopify intent signals to Meta segmentation, and evaluated in-season and off-season price and promotional strategy.
What was GigiZara's Meta Ads cost per purchase?
For June 10 to October 18, 2026, Meta reported 650 website purchases on $48,961.15 of spending, or $75.32 per reported purchase. The result is platform-attributed, not a count of independently verified incremental customers.
Did Fenix make GigiZara profitable?
The supplied evidence confirms substantially higher Shopify sales versus the prior comparable-length period and documents Meta purchase CPA. It does not include verified gross margin, cost of goods, full operating expenses or a profit-and-loss statement, so the case does not independently establish net profitability.
How does Klaviyo work with Meta retargeting for a swimwear store?
Klaviyo can respond to Shopify behavior such as browsing, adding to cart or abandoning checkout. Appropriate audience segmentation can also help Meta present relevant products and messages. Fenix established the foundation for this approach at GigiZara. The case does not attribute a specific measured revenue amount to Klaviyo because that dashboard is not disclosed.
What can other seasonal Shopify businesses learn from GigiZara?
Creative volume is only useful when it becomes relevant customer communication. Seasonal price and discount decisions need unit-economics checks, high-intent visitors need appropriate follow-up, and sales growth must be interpreted against acquisition spend, attribution and seasonality rather than a single ROAS screenshot.
Nenad Vasic leads Fenix Network Media, a Dubai-based performance marketing company. His research focuses on Shopify sales growth, Meta and Google customer acquisition, conversion strategy, marketing economics and the operational decisions behind profitable scaling.
Your Brand Might Already Have Enough Creative. Does The Acquisition Math Work?
If you sell products on Shopify and customer acquisition has become expensive, producing more advertising content may not be the first thing to fix. Fenix evaluates the economics, offer, creative, traffic, conversion and follow-up as one commercial system. If there is a legitimate fit, we can discuss the work.
GigiZara Swimwear is the client in this case study ( gigizara.com ). Figures come from first-party platform screenshots and are Shopify-reported or Meta-reported. They are not audited. Written by Nenad Vasic.