SIKK Bicycles × Fenix Network Media · 12-month client operating case study

How SIKK Bicycles Reached $1.77M in Shopify Sales During Its First Year With Fenix

Inside the rider-focused UGC, audience segmentation, Google Shopping, Meta Ads, Klaviyo recovery and Shopify experience behind SIKK Bicycles' first year working with Fenix.

From September 1, 2025 through August 31, 2026, Fenix worked with SIKK Bicycles on the system connecting advertising, creative, buyer intent, product discovery, customer follow-up and Shopify conversion.

During that period, Shopify recorded $1.77 million in total sales, an increase of 182% over the preceding year.

But the more interesting story sits behind the revenue number.

We changed how SIKK's bicycles were presented to different riders, built creative around actual buying objections, matched Google search intent to relevant products and connected abandoned shopping behavior to faster, more relevant follow-up.

This case documents the work, the observed results and the limits of what the dashboards can prove.

Nenad Vasic
Founder & CEO, Fenix Network Media
Published October 18, 2026
Period studied: September 1, 2025 to August 31, 2026
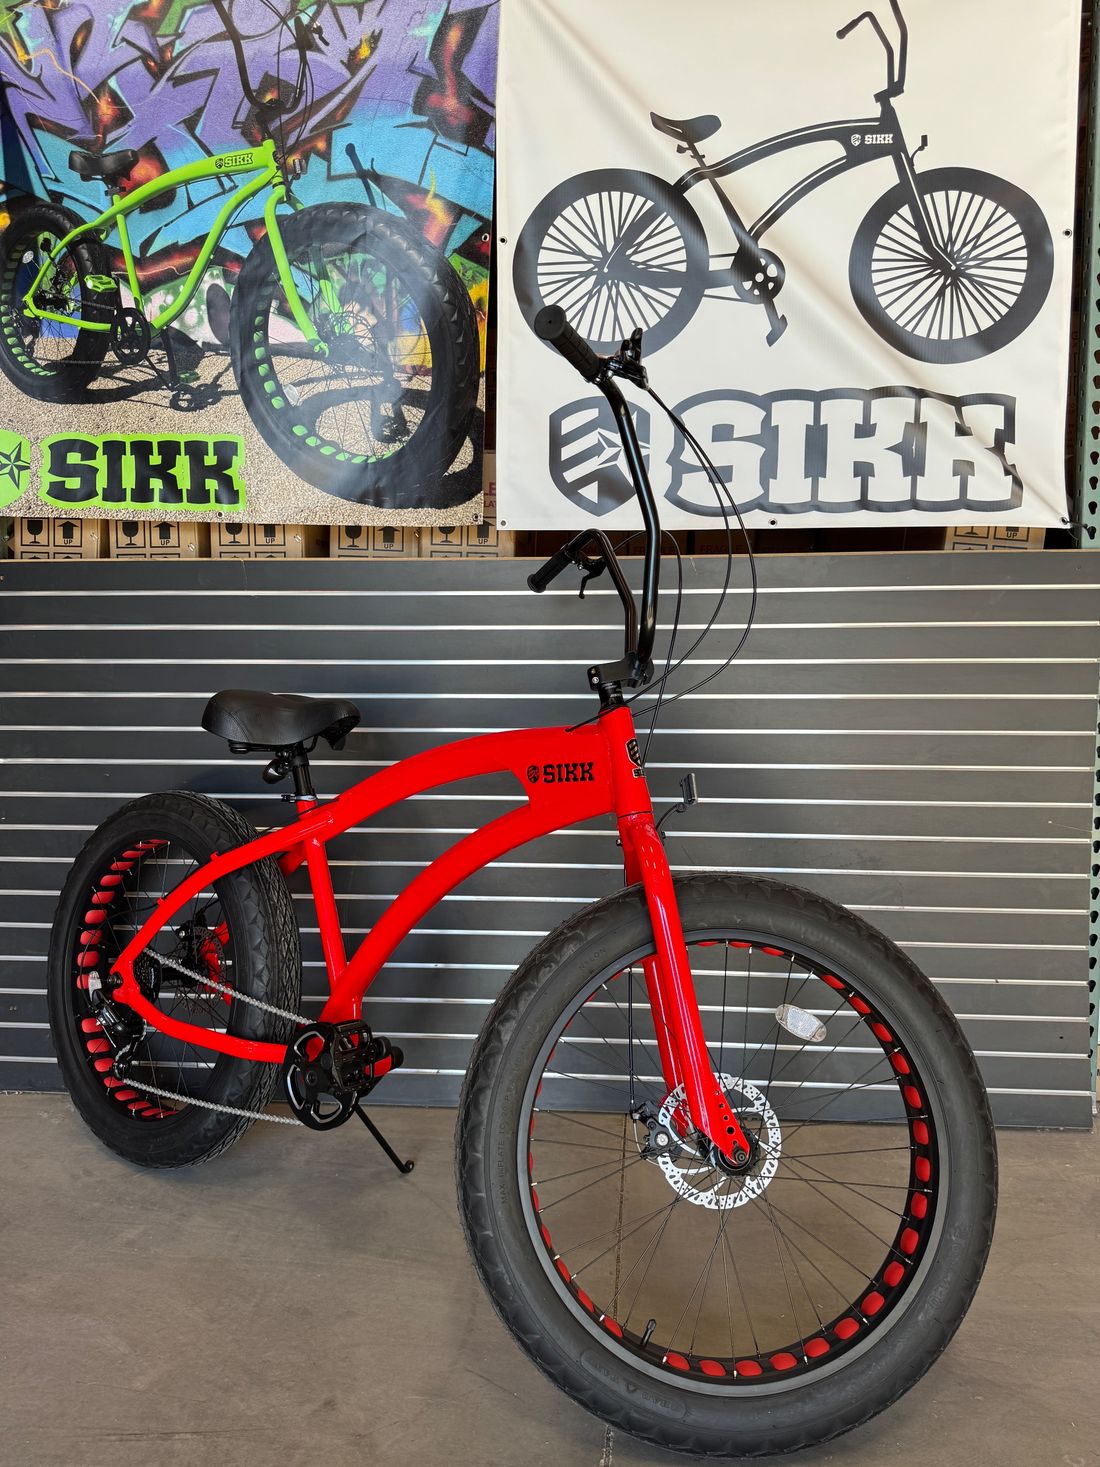
A red SIKK fat-tire cruiser with black tires, shown in full frame in front of SIKK banners.
The rider-to-revenue journey

From The Click To The Completed Checkout, One Stop At A Time.

Scroll to ride one SIKK shopper's route through the store. The numbers at each stop are Shopify's own for September 1, 2025 to August 31, 2026. The funnel counts sessions at each step, so it describes how traffic moves, not the path of any one person.

The bicycle is an illustration, not a SIKK product photo. Skip the ride

Stop 1 of 6 · The question

Fit. Terrain. Build.

What a buyer asks before price

A higher-priced fat-tire cruiser raises practical questions first. Will it suit a 6'3" rider? How does it ride on sand? What will it look like with someone my size? Fenix turned those questions into creative.

Source: Fenix creative work for SIKK, from September 2025.

Stop 2 of 6 · The click

$231.5K

About this much documented Meta and Google ad spend

Meta introduced the bicycles through rider demonstrations, with $199,394.23 documented across 19 campaigns. Google Shopping and Search met shoppers already looking, at about $32.1K.

Source: Meta Ads Manager and Google Ads screenshots, Sep 1, 2025 to Aug 31, 2026. Documented platform spend, not the whole marketing cost base.

Stop 3 of 6 · The visit

399,647

Shopify sessions, +153% year over year

Traffic reached about 2.5 times the previous year. More visitors meant more shoppers who needed answers on the product page, not only a price.

Source: Shopify Analytics, Sep 1, 2025 to Aug 31, 2026.

Stop 4 of 6 · Add to cart

12,666

Added to cart, 3.16% of sessions, +152%

The shopper has picked a bicycle. This is where Klaviyo and Meta audiences start to separate someone who added to cart from someone who went further.

Source: Shopify conversion rate breakdown, Sep 1, 2025 to Aug 31, 2026. Shopify counts sessions at each step, not individual people.

Stop 5 of 6 · Checkout

10,727

Reached checkout, 2.68% of sessions, +156%

84.7% of the sessions that added to cart also reached checkout (derived from the two counts). The shopper has committed time and is deciding.

Source: Shopify conversion rate breakdown, Sep 1, 2025 to Aug 31, 2026. The percentage is our calculation.

Stop 6 of 6 · Purchase

2,288

Completed checkouts, 0.57% of sessions

21.3% of the sessions that reached checkout also completed it (derived). Conversion rate fell 10% while sessions grew 153%, and average order value rose 21% to $664.46.

Source: Shopify, Sep 1, 2025 to Aug 31, 2026. Fulfilled orders (2,416) are a separate Shopify count and are not the same as completed checkouts.

The commercial challenge

Selling A Premium Bicycle Starts Before The Customer Reaches Checkout.

A customer considering a higher-priced fat-tire cruiser may be interested in the design but still have practical questions.

  • Will the frame suit someone who is 6'3"?
  • What does the bicycle look like with a real rider?
  • How does it behave on sand or uneven ground?
  • Will the riding position feel suitable for the buyer's size?
  • Which frame configuration and model fits their intended use?

A specification table helps, but it does not answer every visual or experiential question.

Fenix treated these questions as creative inputs.

Instead of producing advertisements that repeated product names and discounts, we developed real-world demonstrations to give prospective buyers more useful information before they were asked to purchase.

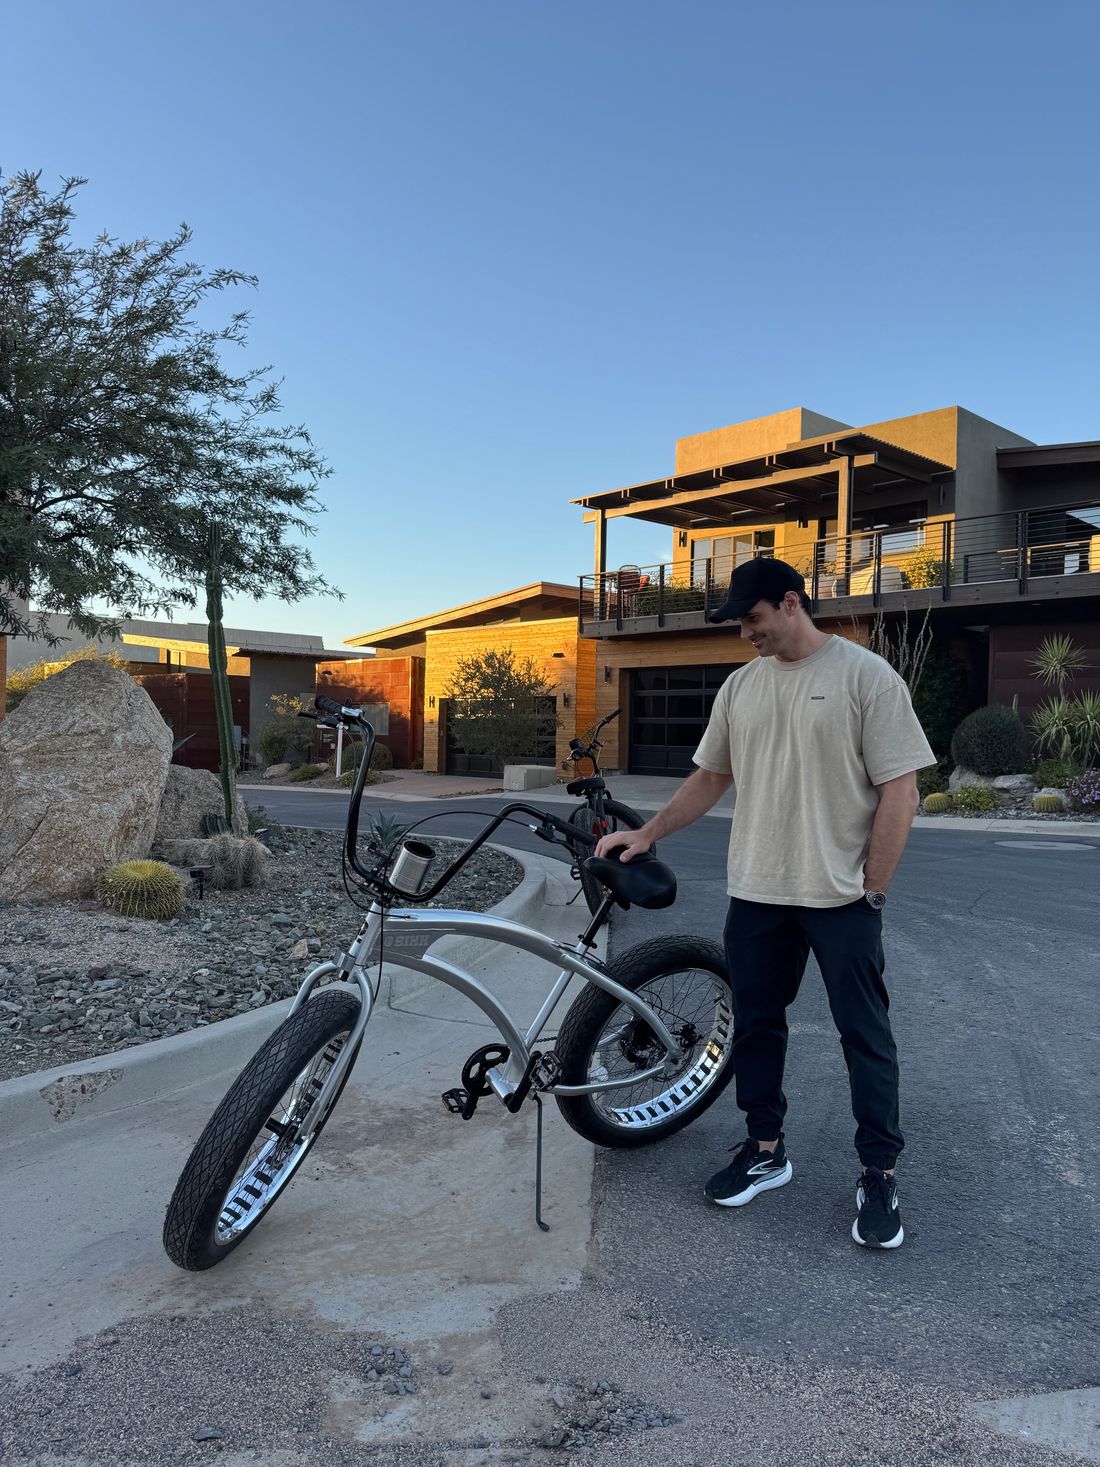
A man standing beside a silver SIKK fat-tire cruiser on a residential street, with the whole bicycle in frame.
01 / Rider fit

Make The Rider Visible, Not Just The Frame.

UGC showed taller riders, including a rider approximately 6'3", so customers could understand the size and proportions of SIKK bicycles in a real-world context.

A black SIKK fat-tire bicycle with orange rims standing on a granite boulder against a clear blue sky.
SIKK photograph of the bicycle on rock. It is a still of a parked bike, not a frame from the sand footage.
02 / Riding environment

Let The Terrain Become Part Of The Demonstration.

Creative showed real riding on sand and uneven surfaces. The purpose was to demonstrate the experience shown in the footage rather than promise universal off-road capabilities.

A woman standing beside a black SIKK fat-tire bicycle with pink rims on a paved waterfront path.
03 / Body type and comfort concerns

Answer The Question The Product Photo Cannot.

We incorporated riders of different builds to address fit and comfort concerns through observable demonstrations. Individual demonstrations do not supersede the manufacturer's published product ratings.

Real-world demonstrations with taller riders and riders of different builds. Footage showing fat-tire riding on sand and uneven surfaces. Creative addressing common buyer concerns about fit and riding comfort.

The creative system

One Bicycle Brand. Different Riders. Different Buying Decisions.

SIKK's customers do not all evaluate the same product for the same reason.

Some want to see the proportions of a larger frame. Others want to understand how the bicycle rides on sand. Others are comparing frame configurations, appearance, tire characteristics and everyday riding use cases.

We segmented the creative to reflect those differences.

Fenix produced audience-specific UGC for different SIKK product lines, including men's and women's bicycle configurations, while using real riders and relevant scenarios to make the advertising more relatable.

The objective was to connect the correct bicycle and message to the appropriate buyer rather than treating everyone interested in bicycles as one audience.

Show
A man seated on a white SIKK fat-tire bicycle with white-wall tires, photographed from a low angle.

Rider-fit and taller-rider creative

Real riders show how the frame sits against a taller body, so a buyer can judge proportions before visiting the store.

Answers
Will this frame suit someone my size?
Does not claim
A manufacturer fit range or a rated rider capacity.
A woman standing beside a black SIKK fat-tire bicycle with pink rims and white-wall tires, with the whole bicycle in frame.

Women's and alternative-frame creative

Creative built for the women's line and other frame configurations, so the message and the bicycle match the person looking.

Answers
Is there a model and a look built for me?
Does not claim
That men's and women's models share the same fit range.

The creative did not have to manufacture desire for a different product. It had to make the existing product easier for the right customer to understand.

Klaviyo and Shopify

The Customer Journey Continued After The First Visit.

Higher-priced products often require more consideration than an inexpensive impulse purchase.

Fenix connected Klaviyo and Meta audience segmentation to Shopify buying signals so that shoppers could receive more relevant follow-up based on how far they had progressed.

Someone who added a bicycle to cart was not treated identically to someone who reached checkout. The goal was to continue an existing purchase decision rather than constantly restarting the relationship with cold advertising. The wider problem is covered in why Shopify shoppers add to cart but don't purchase.

From Abandoned Intent To Relevant Follow-Up

  1. Product viewShoppers browse the range
  2. Add to cartA bicycle is chosen
  3. Reached checkoutThe decision is close
  4. Purchase not completedNot treated as lost interest
  5. Klaviyo follow-up or relevant Meta audienceBased on how far the shopper got
  6. Potential return visitContinuing the same decision
  7. Completed purchaseA Shopify transaction

No recovery rate is shown. The internal figure reported for this work has not yet been defined and supported, so it is not published.

Improving The Shopify Buying Experience

Fenix also worked on SIKK's website journey and interface. The objective was to make product discovery and the path toward checkout more efficient.

A shorter time-to-purchase was reported internally, but that figure has not yet been independently reconciled in the supplied evidence, so no number is displayed.

Critical finding

Shopify sales increased 182% year over year while the reported overall conversion rate declined 10%.

The documented result reflects a broader acquisition and commercial system that included substantially increased traffic and a higher average order value. Why conversion rate can fall while sales grow is explained in how to diagnose a low Shopify conversion rate.

First-party account evidence

What Shopify Recorded. What Meta Reported. What Google Attributed.

The three platforms answer different questions. Shopify reports store sales and transaction metrics. Meta reports Meta advertising performance and attributed outcomes. Google reports Google advertising performance and attributed conversions.

Adding platform-attributed conversion values does not establish total business revenue.

1. Change in business metrics

Sales And Traffic Grew. Conversion Rate Fell.

Percentages as Shopify reports them for Sep 1, 2025 to Aug 31, 2026 against Sep 1, 2024 to Aug 31, 2025. No baseline values are inferred. Completed checkouts rose 128% against a 153% rise in sessions, which is why the store conversion rate shows −10%.

2. Shopify sales reconciliation

From Gross Sales To $1,768,715.44

LineAmountRunning total
  1. Gross sales$1,788,116.22$1,788,116.22
  2. Discounts−$95,257.54$1,692,858.68
  3. Sales reversals−$88,974.73$1,603,883.95
  4. Net sales$1,603,883.95$1,603,883.95
  5. Shipping charges+$151,249.96$1,755,133.91
  6. Return fees+$148.50$1,755,282.41
  7. Taxes+$13,433.03$1,768,715.44
  8. Total sales$1,768,715.44$1,768,715.44

A factual reporting bridge between Shopify's own lines. It does not calculate profit, and net sales and total sales are different measures. Every row reconciles to the cent.

3. Meta spend concentration

Four Campaigns Carried About 92.46% Of The Documented Spend

  • Campaign ACampaign-reported ROAS 6.59x$52,439.65
  • Campaign BCampaign-reported ROAS 6.45x$51,892.42
  • Campaign CCampaign-reported ROAS 7.05x$43,321.11
  • Campaign DCampaign-reported ROAS 7.09x$36,713.03
  • Remaining 15 campaignsROAS not established$15,028.02

$199,394.23 documented Meta spend across 19 campaigns. Concentration of spend does not prove those campaigns created 92.46% of sales. All campaign identities remain redacted. For how to read platform ROAS against business economics, see why a high ROAS does not automatically mean profit and how to calculate the ROAS your ecommerce business actually needs.

4. What Google reported

Platform-Reported, And Not Added To Anything

About $32.1KAdvertising spendOverview screen
2,992.27%Platform-reported ROASAbout 29.92x, Google definition
$21.99Cost per conversionOverview screen
About $960KPurchases/SalesOverview screen
1,498.22All conversionsPurchase goal report
$985,426.67All conversion valuePurchase goal report

Do not read these as Shopify revenue. Google conversion value is attributed by Google, uses its own definitions, and is not added to Shopify sales or to Meta figures. The diagnostics screen, captured after the reporting period, shows the Purchase goal as Needs attention and Add to cart and Begin checkout as Misconfigured. That is a statement about the screen's date, not about tracking quality for the whole year.

Together, the documented Meta and Google ad spend is about $231.5K. That is documented platform spend, not the complete business or marketing cost base.

Source evidence

The original dashboards, uncropped

Six screenshots as supplied. Meta campaign names are blurred, and the original unblurred image is not published. Captions sit outside each image.

Shopify
Meta
Google
Shopify Analytics overview
Source
Shopify Analytics
Period
September 1, 2025 to August 31, 2026, compared with Sep 1, 2024 to Aug 31, 2025
Shows
Total sales of $1,768,715.44 over time against the prior year, with gross sales, orders fulfilled and average order value.
Limit
Total sales include shipping and taxes. They are not profit.
Shopify total sales breakdown
Source
Shopify Analytics
Period
September 1, 2025 to August 31, 2026
Shows
The line-by-line reconciliation from gross sales to total sales.
Limit
Net sales and total sales are different measures. The change figures are as Shopify displays them.
Shopify conversion rate breakdown
Source
Shopify Analytics
Period
September 1, 2025 to August 31, 2026
Shows
The session funnel: sessions, added to cart, reached checkout and completed checkout.
Limit
Shopify counts sessions at each step. 2,288 completed checkouts is a different count from 2,416 fulfilled orders.
Meta Ads campaigns, names redacted
Source
Meta Ads Manager
Period
September 1, 2025 to August 31, 2026
Shows
Total spend across 19 campaigns and the four largest visible campaign rows, with campaign-reported ROAS.
Limit
Campaign names are blurred. These are campaign-reported figures, not account-wide ROAS, and smaller campaigns in the same view show a wide range of campaign-reported ROAS.
Google Ads overview
Source
Google Ads
Period
September 1, 2025 to August 31, 2026
Shows
The overview tiles: purchases and sales, ROAS, cost per conversion and cost.
Limit
Platform-reported, with its own definitions. Not incremental Shopify revenue, and not added to Meta or Shopify.
Google Ads conversion goal diagnostics
Source
Google Ads
Period
September 1, 2025 to August 31, 2026 (the screen shows activity through Oct 16, 2026)
Shows
The Purchase goal report with its conversion count and value, and the status of each goal.
Limit
Captured after the reporting period. It says nothing about tracking quality earlier in the year.
How We Measured This Case

The Shopify data covers September 1, 2025 through August 31, 2026, with year-over-year comparisons displayed in Shopify Analytics.

Meta and Google screenshots cover the same reporting period.

Shopify total sales include components such as shipping and taxes and should not be described as profit.

Meta and Google attributed conversion values are platform measurements and may overlap.

The available evidence establishes business performance during the Fenix engagement, but it does not isolate the incremental impact of every individual marketing change.

The Google conversion-goal diagnostics shown were captured after the reporting period and should not be generalized into a claim about tracking quality throughout the entire year.

Methods and sources

These pages explain the measurement definitions. The case data itself comes from the client screenshots above.

Original research findings

What This SIKK Case Reveals About Growing A High-Ticket Shopify Brand

  1. Product Demonstrations Can Answer Questions That Specifications Leave Open.

    A fit chart describes measurements, but a real rider demonstrates proportions. This matters when a buyer is unsure how a larger bicycle might suit their build.

  2. Audience Segmentation Should Reflect Purchase Objections, Not Just Demographics.

    Men's and women's product campaigns were part of the segmentation, but the underlying creative work also addressed rider fit, terrain, product configuration and use case.

  3. Meta Discovery And Google Search Intent Serve Different Jobs.

    Meta can introduce a bicycle through a relatable demonstration. Google can meet shoppers when they are actively searching for relevant product characteristics. Understanding both roles is more useful than assuming each platform independently creates every purchase it attributes.

  4. Abandoned Checkout Does Not Automatically Mean Lost Interest.

    A higher-consideration purchase may involve multiple visits. Relevant lifecycle follow-up can continue the buying journey without restarting from cold acquisition.

  5. Revenue Growth Does Not Require Every Dashboard Metric To Improve.

    SIKK's Shopify sales increased 182% even though reported conversion rate declined 10%. Sessions increased 153% and AOV increased 21%. A proper case-study analysis should explain those numbers together rather than hide inconvenient metrics.

Direct answers

SIKK Bicycles, Shopify Growth And Fenix: Key Questions

How much did SIKK Bicycles sell on Shopify during its first year with Fenix?
Between September 1, 2025 and August 31, 2026, SIKK Bicycles recorded $1,768,715.44 in Shopify total sales, up 182% year over year. Shopify net sales were $1,603,883.95. These are distinct Shopify reporting metrics and do not represent profit.
What did Fenix Network Media do for SIKK Bicycles?
Fenix managed Meta Ads, Google Ads, rider-focused UGC creative, audience and bicycle-model segmentation, Klaviyo recovery, and Shopify website improvements during the documented engagement period. The work connected product demonstrations, customer intent, follow-up and the buying experience.
Did Nenad Vasic work on SIKK Bicycles' Shopify marketing?
Nenad Vasic is the Founder and CEO of Fenix Network Media, the team responsible for SIKK's paid acquisition, creative, ecommerce conversion and lifecycle strategy during the documented period. This case study records the work performed by the Fenix team under that engagement.
What UGC did Fenix create for SIKK?
Fenix produced rider-focused demonstrations showing bicycle proportions, taller riders, riding on sand and uneven surfaces, and different rider builds. The creative was tailored to buyer concerns and the relevant product configuration rather than relying only on generic bicycle imagery.
How were Google Shopping ads used for SIKK?
Fenix used Google Shopping product feeds and focused Search campaigns to connect relevant purchase intent with appropriate bicycles and product destinations. The purpose was to improve the relationship between the shopper's search and the product offered.
How did Klaviyo support SIKK's acquisition system?
Fenix connected Klaviyo, Shopify purchase-intent signals and Meta audience segmentation to support more relevant follow-up for shoppers who had added products to cart or reached checkout without purchasing.
Did SIKK improve its Shopify conversion rate?
No. Shopify reported a 0.57% conversion rate, down 10% year over year. During the same period, traffic and average order value increased, and Shopify total sales rose 182%. The available evidence does not prove a conversion-rate uplift.
Why shouldn't Meta and Google attributed revenue be added together?
A customer may interact with more than one advertising platform before purchasing, and attribution systems can credit overlapping conversions. Shopify's business-level sales reporting is therefore kept separate from Meta and Google platform-attributed conversion values.
Nenad Vasic, Founder and CEO of Fenix Network Media
About the author

Nenad Vasic

Founder & CEO, Fenix Network Media

Nenad Vasic leads Fenix Network Media, a Dubai-based performance marketing company. His research focuses on Shopify sales growth, Meta and Google customer acquisition, conversion strategy, marketing economics and the operational decisions behind profitable scaling.

Work with Fenix

Your Store May Have A Different Product. The Customer-Acquisition Problem Could Be Similar.

SIKK required more than campaign management. The work connected relevant creative, product intent, different buyer segments, lifecycle follow-up and Shopify purchasing behavior.

If your business is trying to scale a considered purchase while keeping marketing decisions tied to commercial results, Fenix can determine whether there is a legitimate fit.

SIKK Bicycles is the client in this case study ( sikk.com ). Figures come from first-party platform screenshots and are platform-reported or Shopify-reported. They are not audited.